Pipeline tracker with stage definitions
One place for every deal, with written stage definitions, so pipeline value, weighted value, coverage and win rate mean the same thing every week.

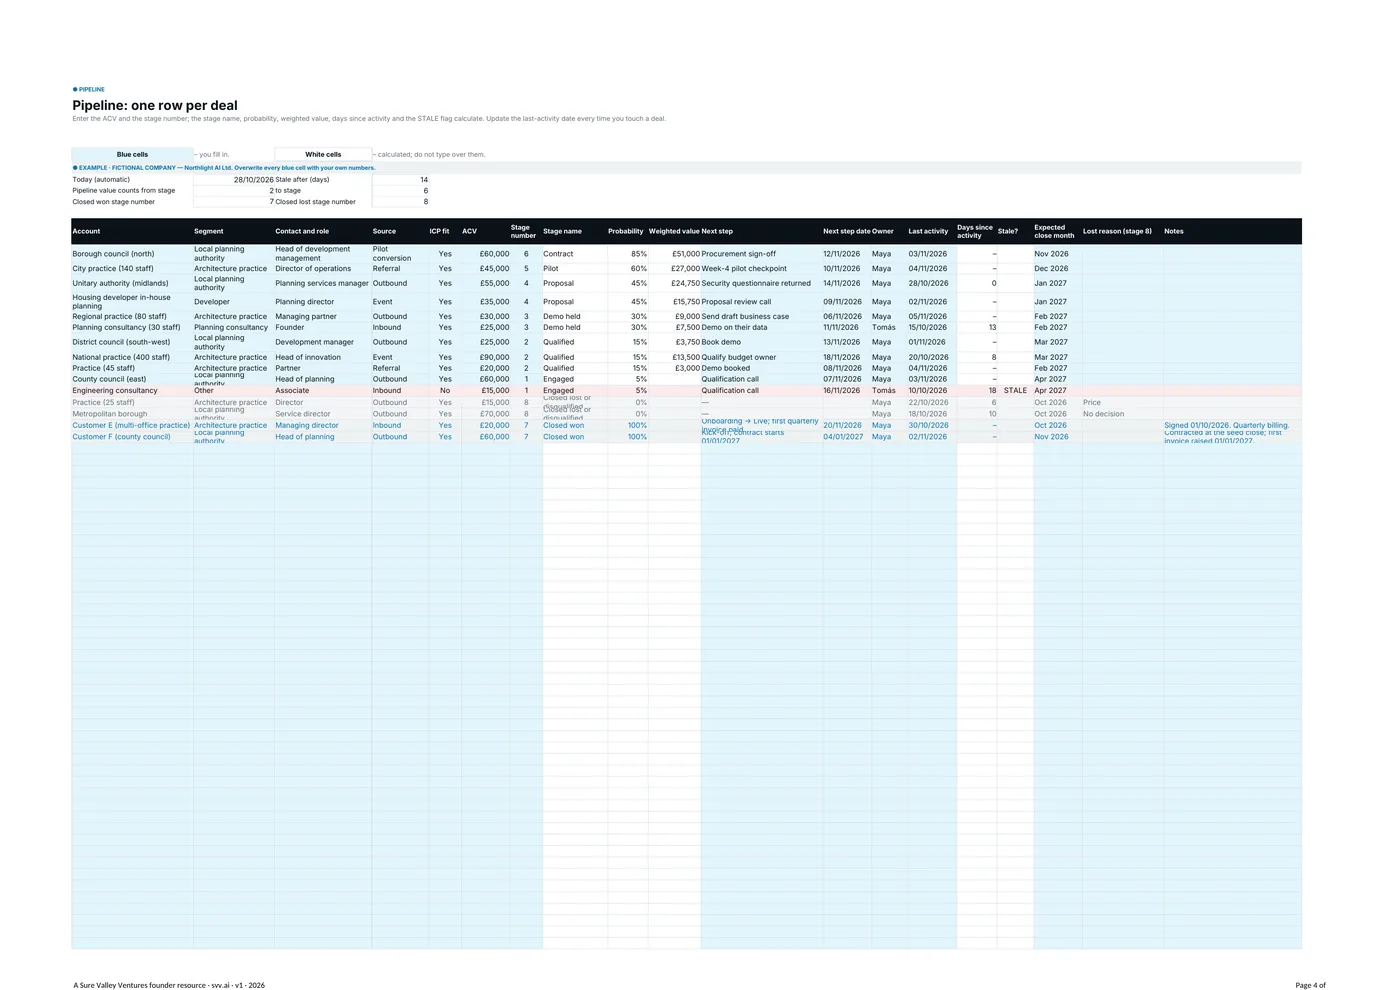
A pipeline tracker for founder-led sales. Enter each deal’s value and stage number, and it works out the stage name, probability, weighted value, days since the last activity and a STALE flag. The end-of-day snapshot is a one-page view to screenshot at 17:30.
What’s inside
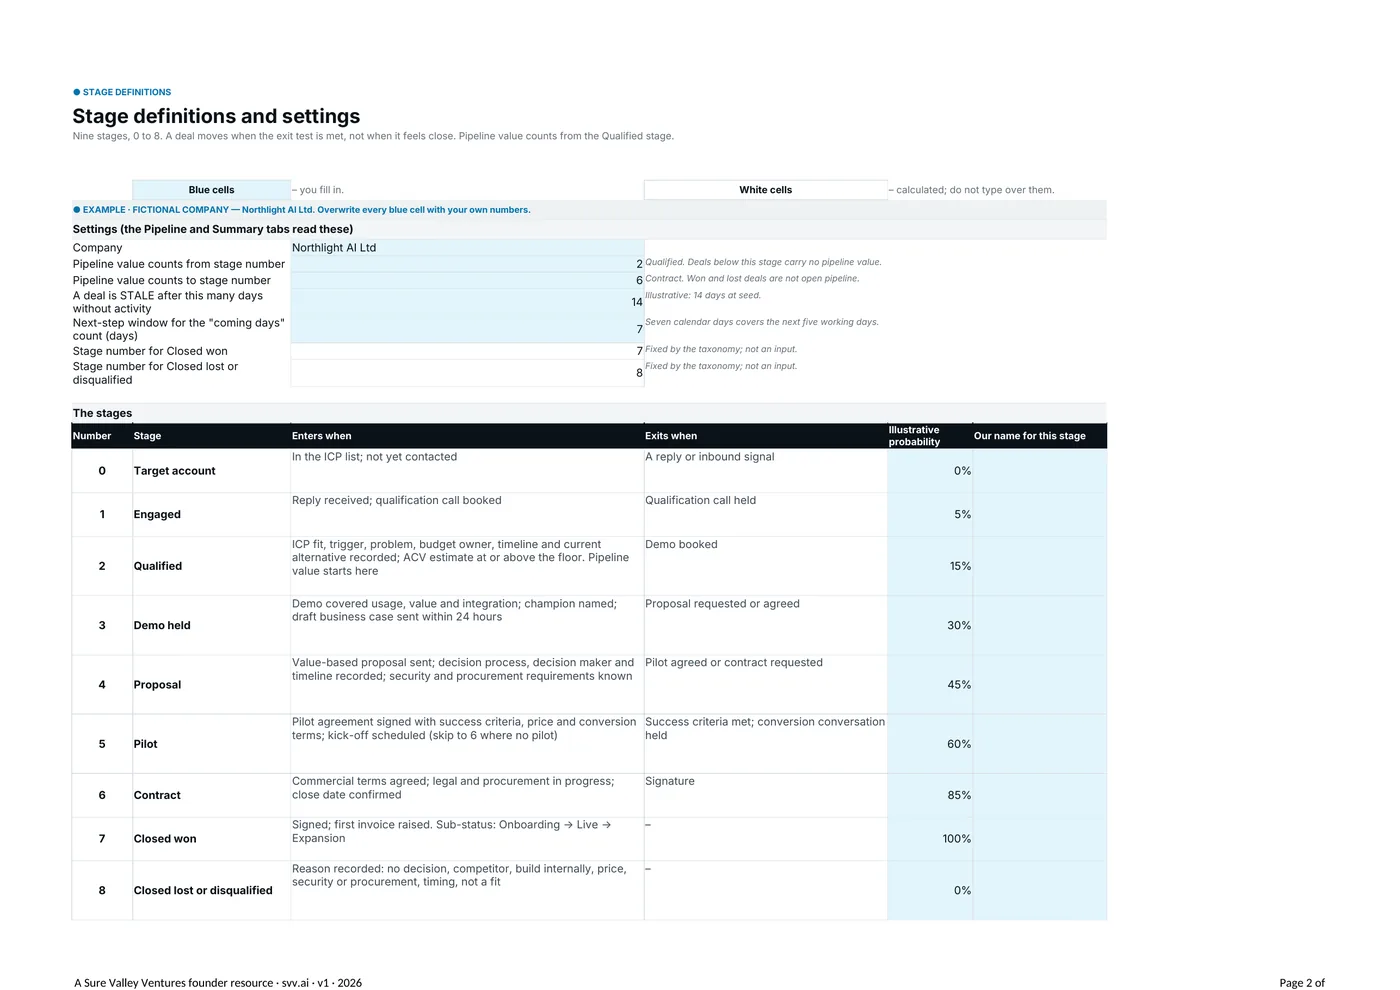
- Stage definitions: stages 0 to 8, probabilities, settings and the lost-reason list
- Pipeline: one row per deal, 60 rows
- Summary: by stage, qualified and weighted pipeline, coverage and win rate
- Lost reasons: count and share by reason
- End-of-day snapshot: the one-page view
Start here. List every live conversation with its account, value, stage, next step and date. Set the quarter and the new-ARR target on the Summary tab and read coverage. Then fix every STALE deal.
Every file comes filled in with a worked example for Northlight AI Ltd, a fictional company. Blue cells are yours to overwrite; white cells calculate. Formats show £: for €, change the currency format on the number cells.